How do I read a market detail page?
Open any market from the Explore map or your dashboard, then read it top to bottom. Tap any metric’s ? for a definition, or open the methodology page for the full calculation.
- 1
The headline — the page leads with the Alpha Score ring, the temperature badge (e.g. Hot Seller’s), a data-confidence chip, and a one-line plain-language read, plus quick actions (Add to Watchlist, View on Map, Shareable brief).
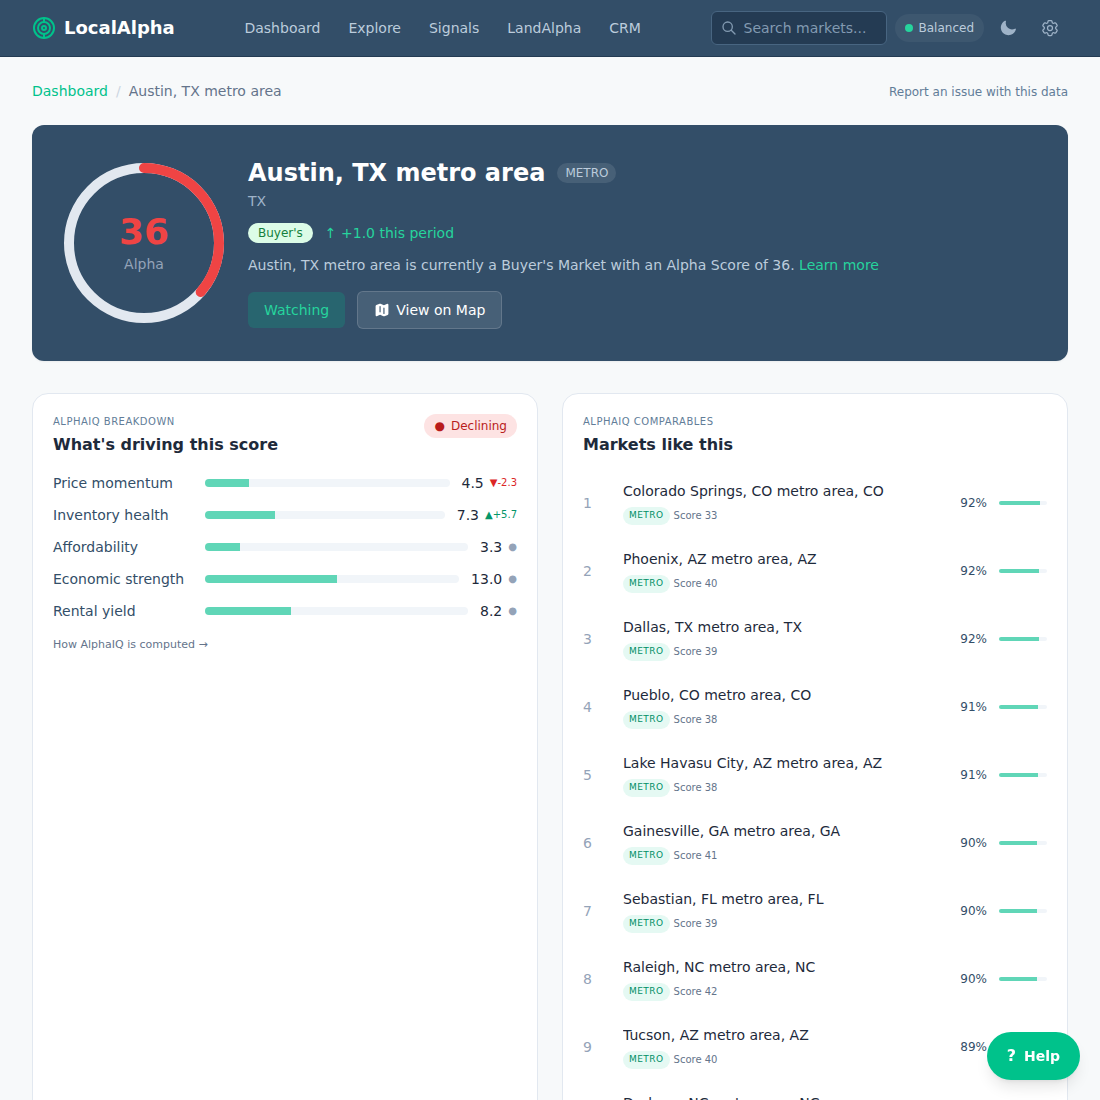
A market page leads with the Alpha Score + temperature, then the Score Breakdown, Market Phase, key metrics, trend chart, signals, similar markets, and (for metros) child ZIPs. - 2
Score Breakdown shows what each measured dimension contributes to the overall score, with the weight it actually carried and a ? definition — so you can see what’s lifting or dragging the market. A dimension we have no data for is marked “No data” and shows no weight and no contribution, because it was left out of the score entirely.
- 3
Market Phase places the market in its cycle (emerging, growing, mature, peaking, declining, recovering) — a classification of where it sits, not a price forecast.
- 4
How is this market valued? A free valuation lens plots five signals on an undervalued→fair→overvalued track with each threshold marked, so you see how far past the line the market sits and which signals lead. A separate read from the Alpha Score, not a slice of it.
- 5
Affordability history (Pro) tracks the monthly payment on the median-priced home at the prevailing 30-year rate, as a share of local income, over the last 24 months. It moves with the rate cycle even when prices are flat — the trend a single snapshot can’t show.
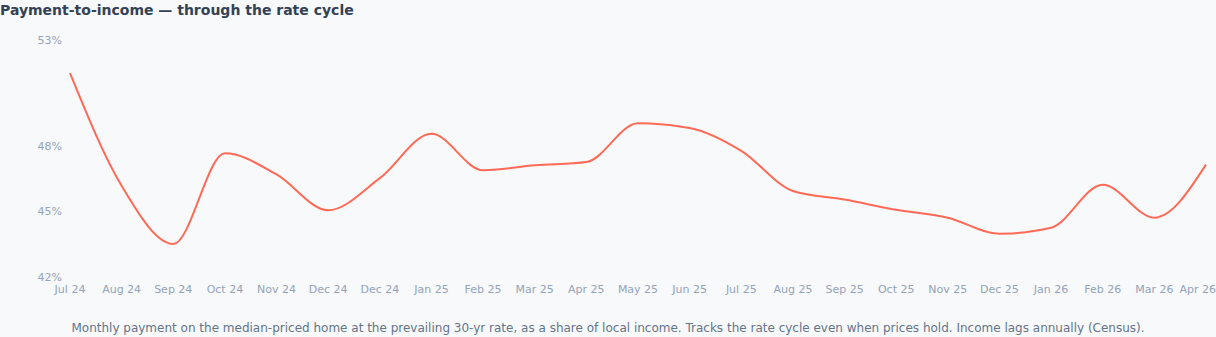
The Pro affordability-history chart plots payment-to-income over 24 months, so you can see the rate cycle move the payment burden even when prices hold. - 6
The rest: key metrics with year-over-year change, a score trend chart, active signals, similar markets, and — for metros — the child ZIPs ranked by score.
Last updated 2026-07-02