How do I tell if a market is overvalued?
The Alpha Score answers “how strong is this market?” Overvaluation answers a different question — “how far has price pulled away from the fundamentals?” — so it gets its own read rather than being buried inside the Affordability dimension. The lens is free on every metro and county market page.
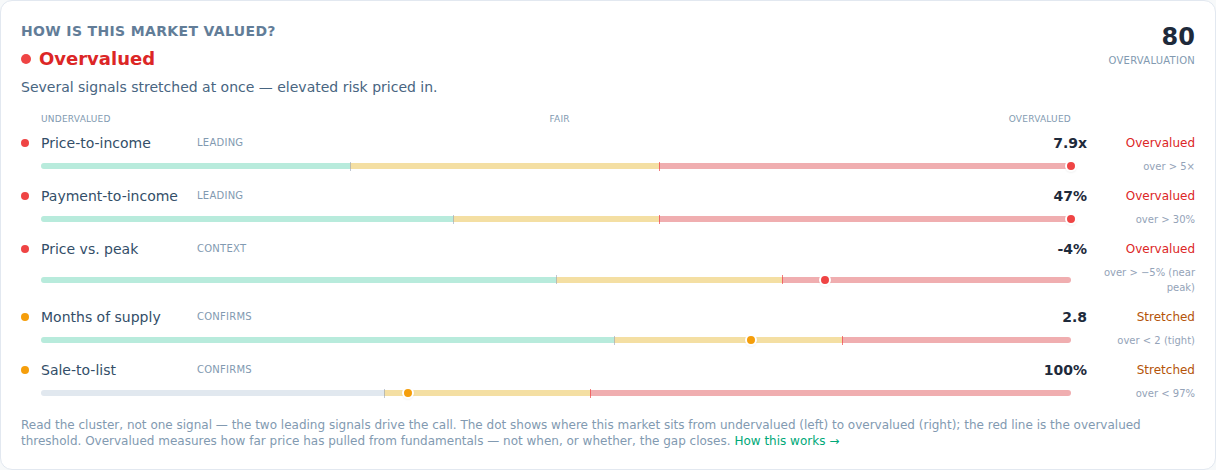
The signals are grouped as leading (price-to-income, payment-to-income), context (price versus its all-time peak), and confirming (months of supply, sale-to-list). One stretched signal is noise; several stretched at once is the pattern. Income and rent inputs refresh annually, so treat the read as a slow-moving risk gauge, not a market-timing tool. Every underlying metric is defined on the methodology page.
Pro members can be alerted the moment a watched market first crosses into the overvalued band — the alert fires only on that upward crossing, so you hear when a market turns risky rather than re-hearing that it already is. Add markets to watch from your dashboard or the Explore map.
Last updated 2026-07-02