How do I use the Explore map?
The Explore map puts an interactive map beside a synced, filterable market list. The walkthrough below covers the core moves — choosing a level, recoloring the map with overlays, and reading a metric — and the full overlay directory is at the bottom.
Free vs Pro. The base Alpha Score map and the five Alpha Score dimension overlays are free for everyone. Every other overlay — plus ZIP-level detail — is Pro: it shows a Pro badge, and selecting it on a free plan opens an upgrade prompt instead of switching the map.
Overlay directory — what you can view, and where. Levels are abbreviated metro · county · ZIP · city:
Alpha Score Dimensions — Free · all levels:
- Price Momentum
- Inventory Health
- Affordability
- Economic Strength
- Rental Yield
Market Activity — Pro · all levels:
- Median Sale Price
- Days on Market
- Months of Supply
- Sale-to-List Ratio
Affordability & Investment — Pro · metro, county, ZIP:
- Price-to-Income Ratio
- Gross Rental Yield
- Mortgage Burden
- Vacancy Rate
- Rent Growth YoY
Economy — Pro:
- Unemployment Rate — metro & county
- Job Growth YoY — metro & county
- Avg Weekly Wage — county only
- Business Establishments — county only
Demographics — Pro:
- Population — metro, county, ZIP
- Net Migration — county only
- Avg Income of Movers In — county only
- Net AGI Change — county only
Price Trends, Rental Market & Construction — Pro:
- House Price Index (FHFA) — metro, county, ZIP
- Fair Market Rent, 2BR (HUD) — metro, county, ZIP
- Building Permits — county only
AlphaIQ & Land — Pro:
- Lifecycle Phase — all levels
- Land Alpha Score, Land STR 3mo, Land Median DOM, Land Active Listings — county only (Land Alpha plan)
A diagonally hatched boundary means we do not have enough data to give that market a number for the metric you are viewing — it is marked as unmeasured rather than coloured, so it can never be mistaken for a mid-range score. It covers the cases where we have nothing to show you: the geography is absent from our data, or we hold no value for the metric you picked, or that metric is not published at the level you are on (switch to a supported level, per the badges above). On an Alpha Score dimension overlay it also appears where that dimension is not measured for the market — it is left out of the score and the remaining weights are re-scaled — so a dimension can hatch on a market whose overall score is perfectly solid. The legend calls this Not enough data. For the full definition and data source of any metric, tap its ? in the overlay list or read the methodology.
- 1
Open Explore. The map sits beside a synced market list — pan and zoom to load markets for the current view, click a list row to fly the map there, and click a marker or boundary to see its Alpha Score and open the full market page.
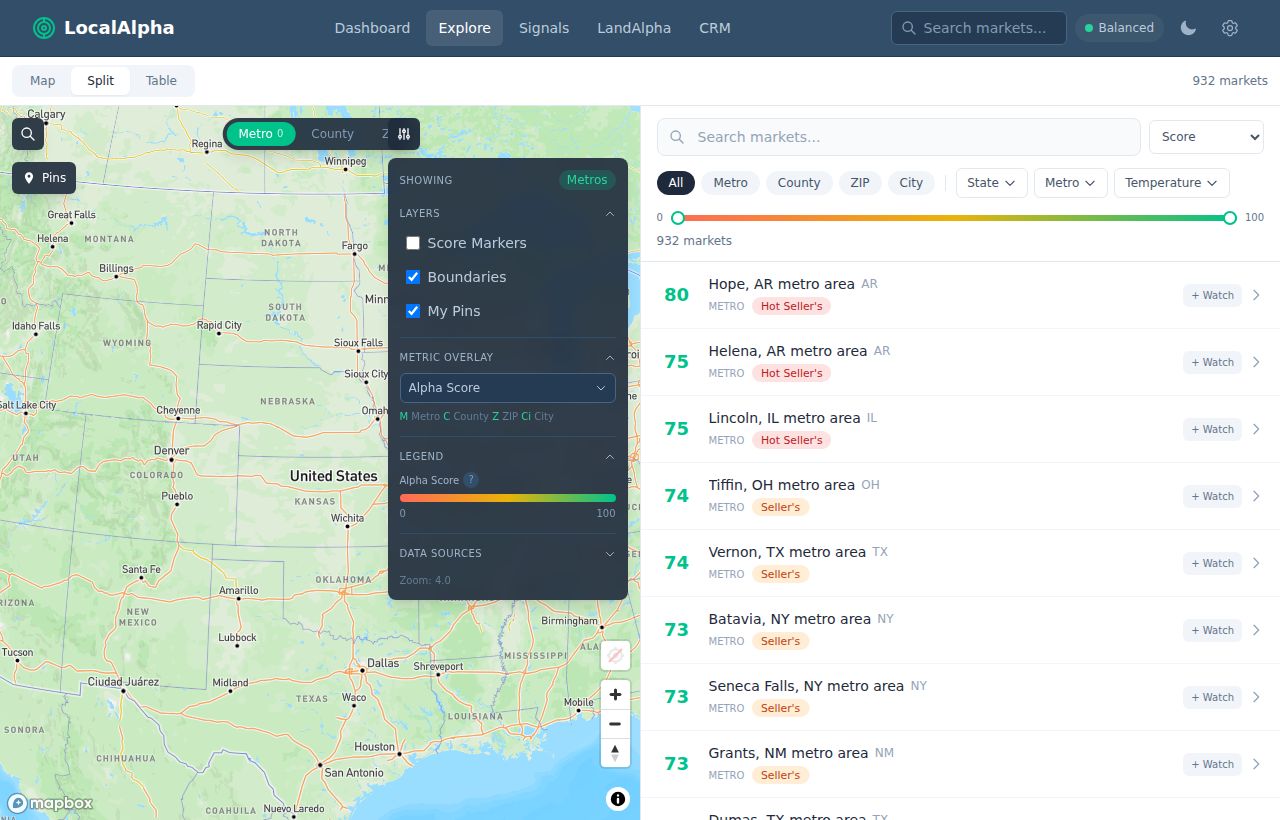
Explore: the map and a synced list side by side, with the level pills on top and the Map controls panel at the map’s top-right. - 2
Choose a geography level. The Metro · County · ZIP pills on top of the map show what you’re viewing. The map auto-switches as you zoom, and the count shows how many markets are loaded; tap a pill to lock that level, tap again to unlock. ZIP-level detail is Pro — free explores at metro and county.
- 3
Recolor the map with an overlay. Open Map controls (top-right of the map) and pick a Metric Overlay. Each row shows a ? for its definition, an M / C / Z / Ci badge for the levels it supports, and a Pro badge on locked overlays. The legend updates to match the overlay you choose.
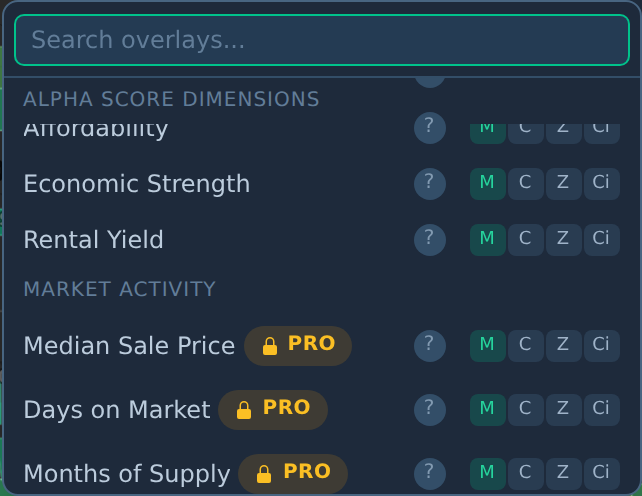
Each overlay row: a "?" definition, an M/C/Z/Ci level badge, and a Pro badge on locked overlays. The five dimensions are free. - 4
Get a metric’s definition. Tap the ? on any overlay for a plain-language explanation, its data source, and a methodology link — it pops up over the map.
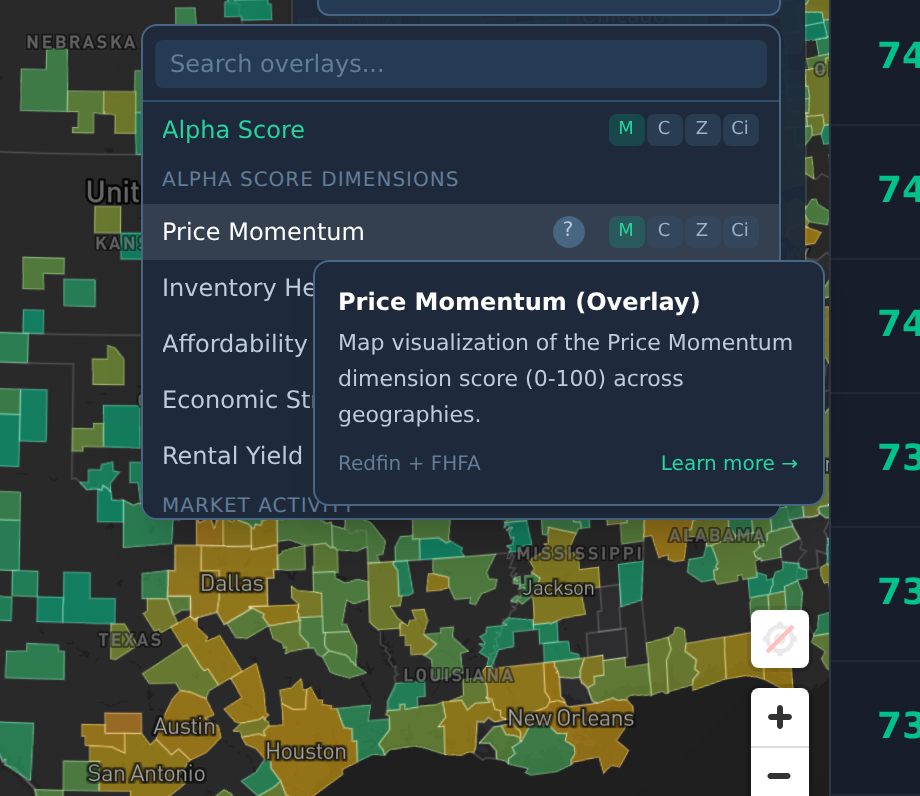
The "?" popover defines the metric, cites its source, and links to the methodology. - 5
On a phone. The controls collapse to a Layers & data button and the level pills move to their own row, so everything stays tappable — the ZIP pill shows its Pro lock.
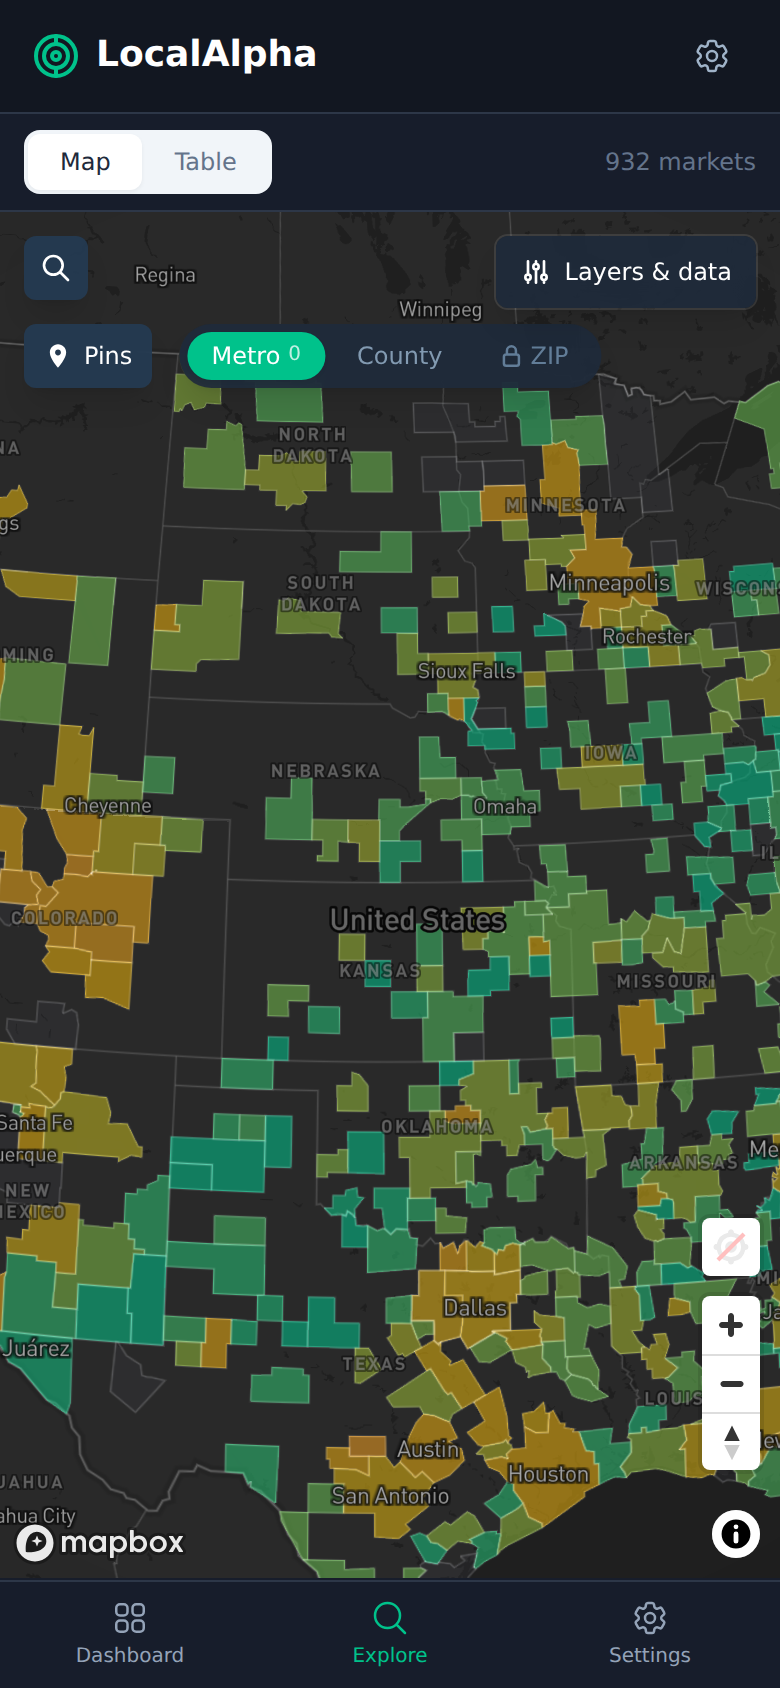
On mobile the level pills sit on their own row below the controls; the ZIP pill shows its Pro lock.
Last updated 2026-08-23