Data reports
The Most Oversupplied Corner of American Housing Is the Vacation Home
Second-home markets carry nearly twice the unsold inventory of everywhere else — and a tail of them is sitting on more than a year of it.
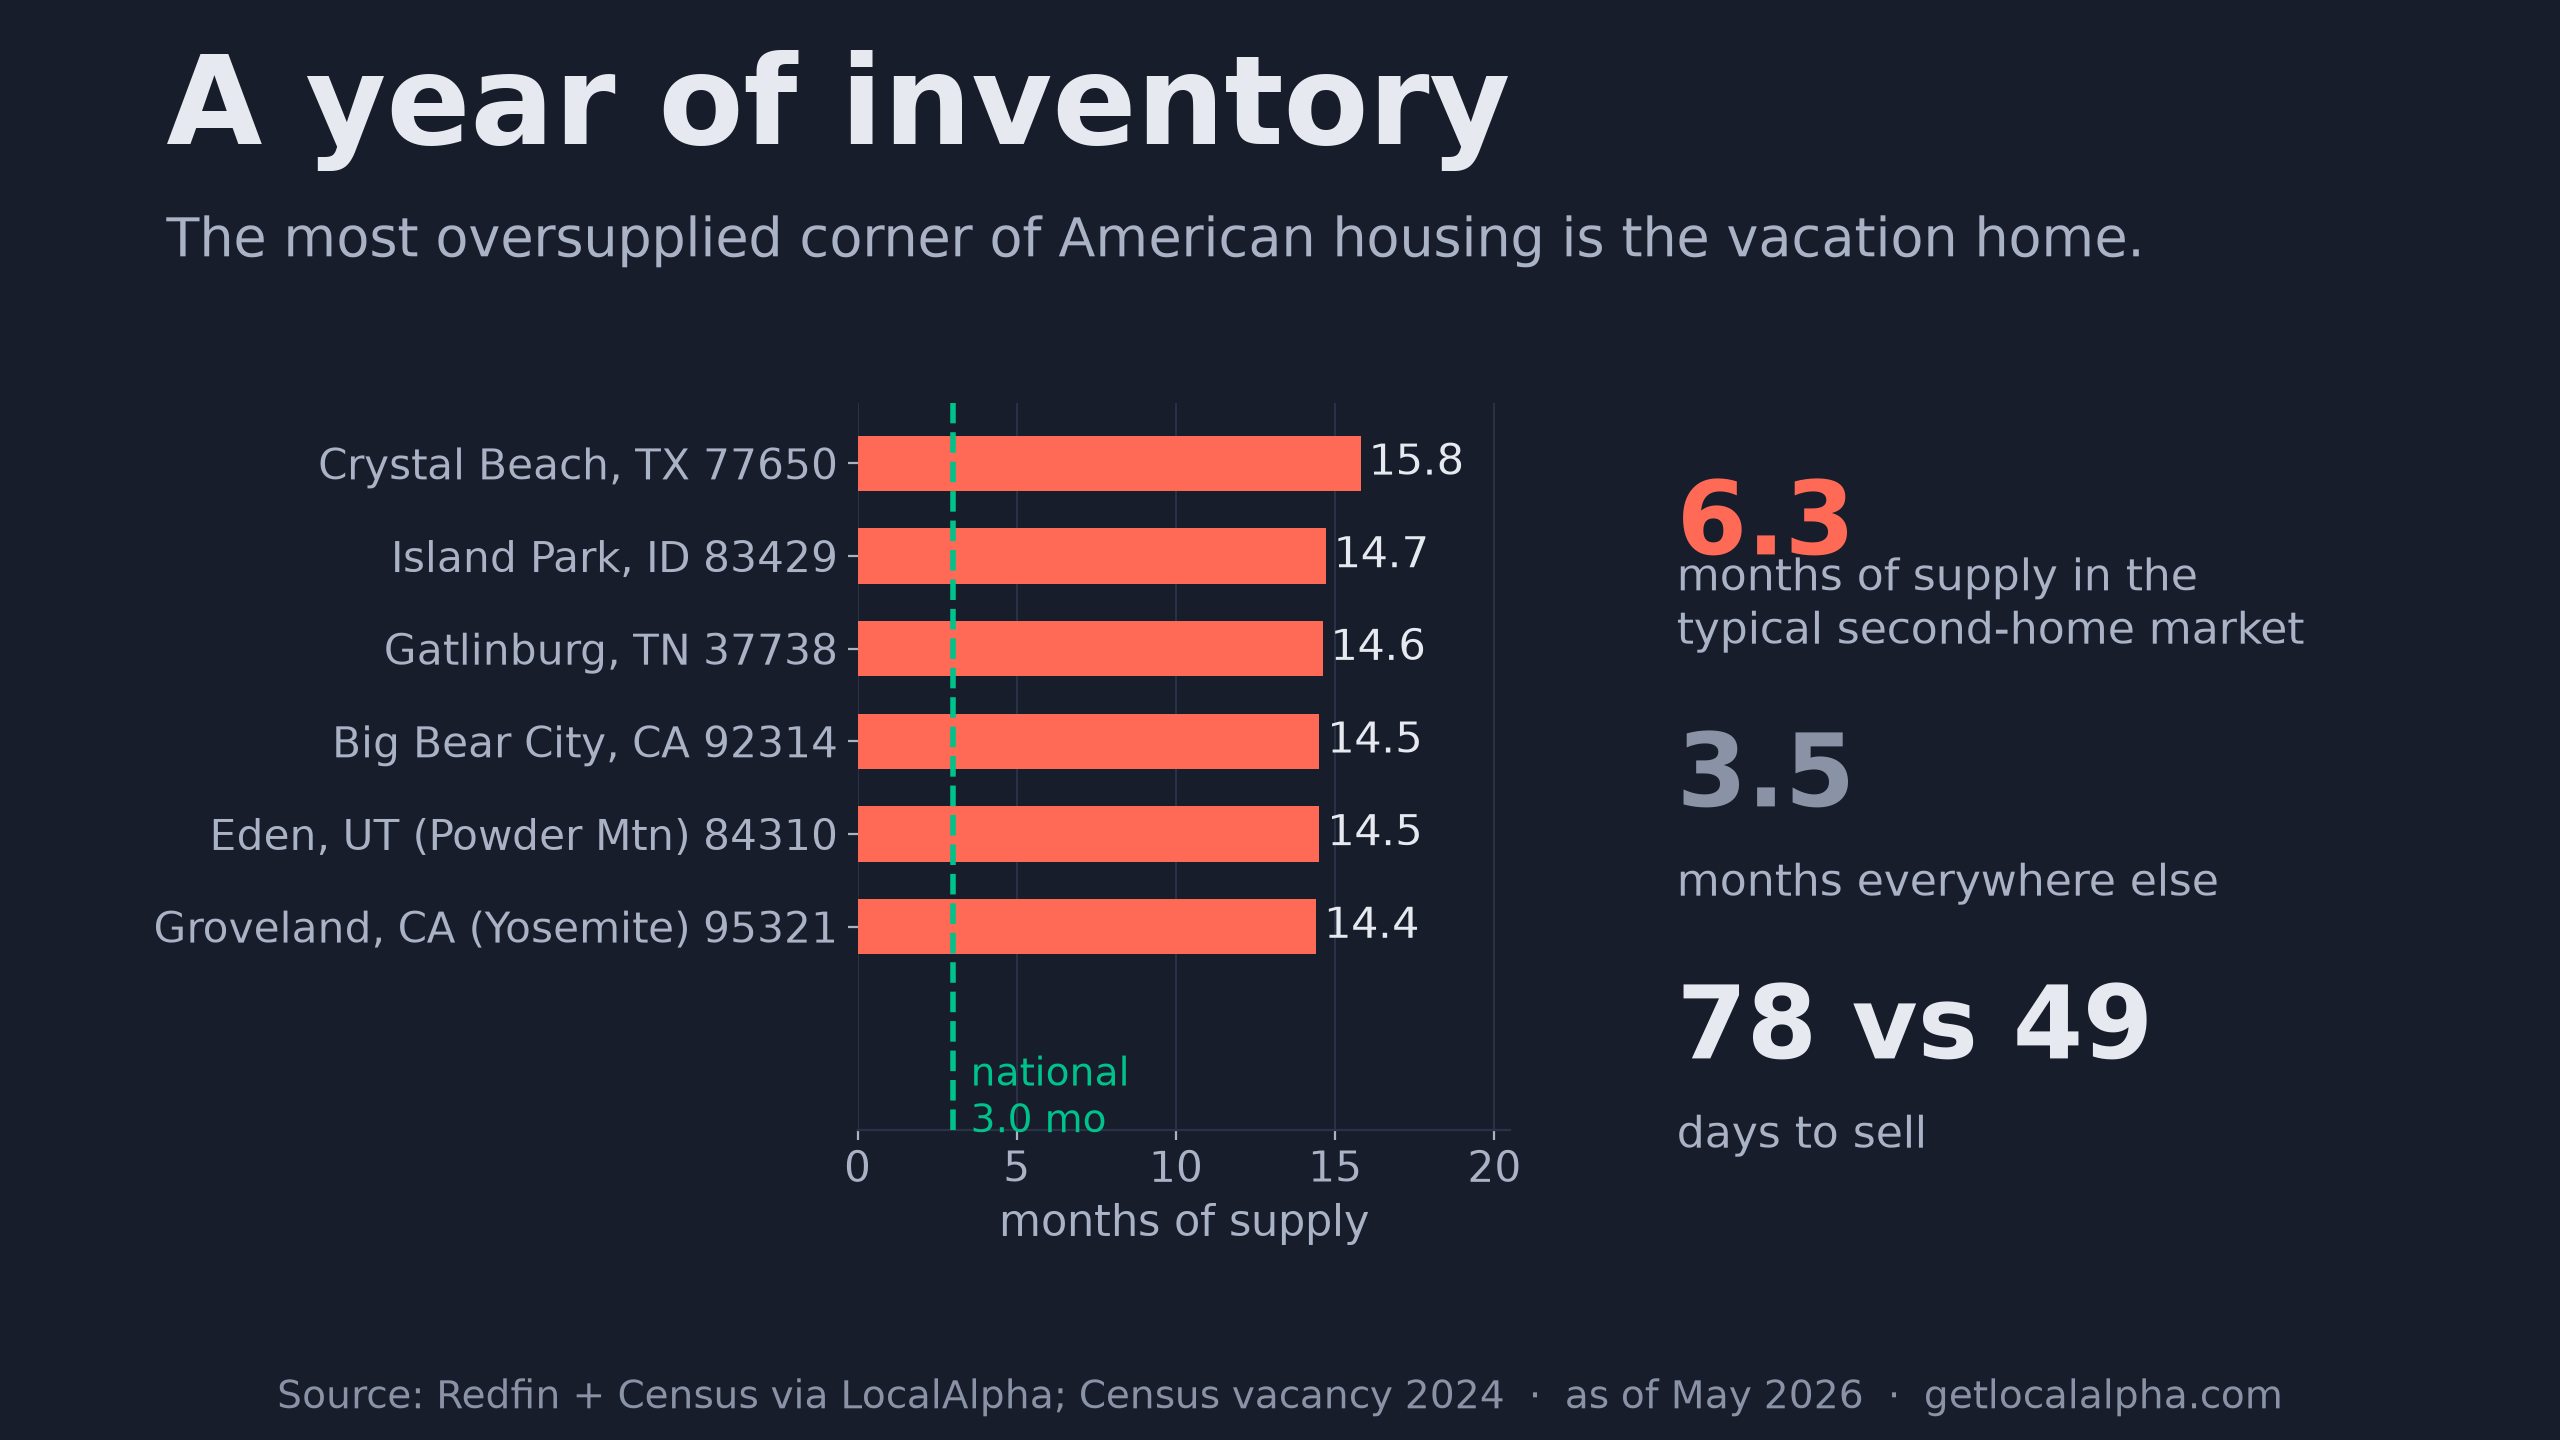
One number separates a housing market where sellers are in charge from one where buyers are: months of supply. How long it would take to sell every home currently listed, at the pace homes are actually selling. Four to six months is balanced. The typical American ZIP code sits at three. Tight.
Then there is the vacation home, running at more than double that, with a tail of markets sitting on over a year of unsold inventory. Here is the gap:
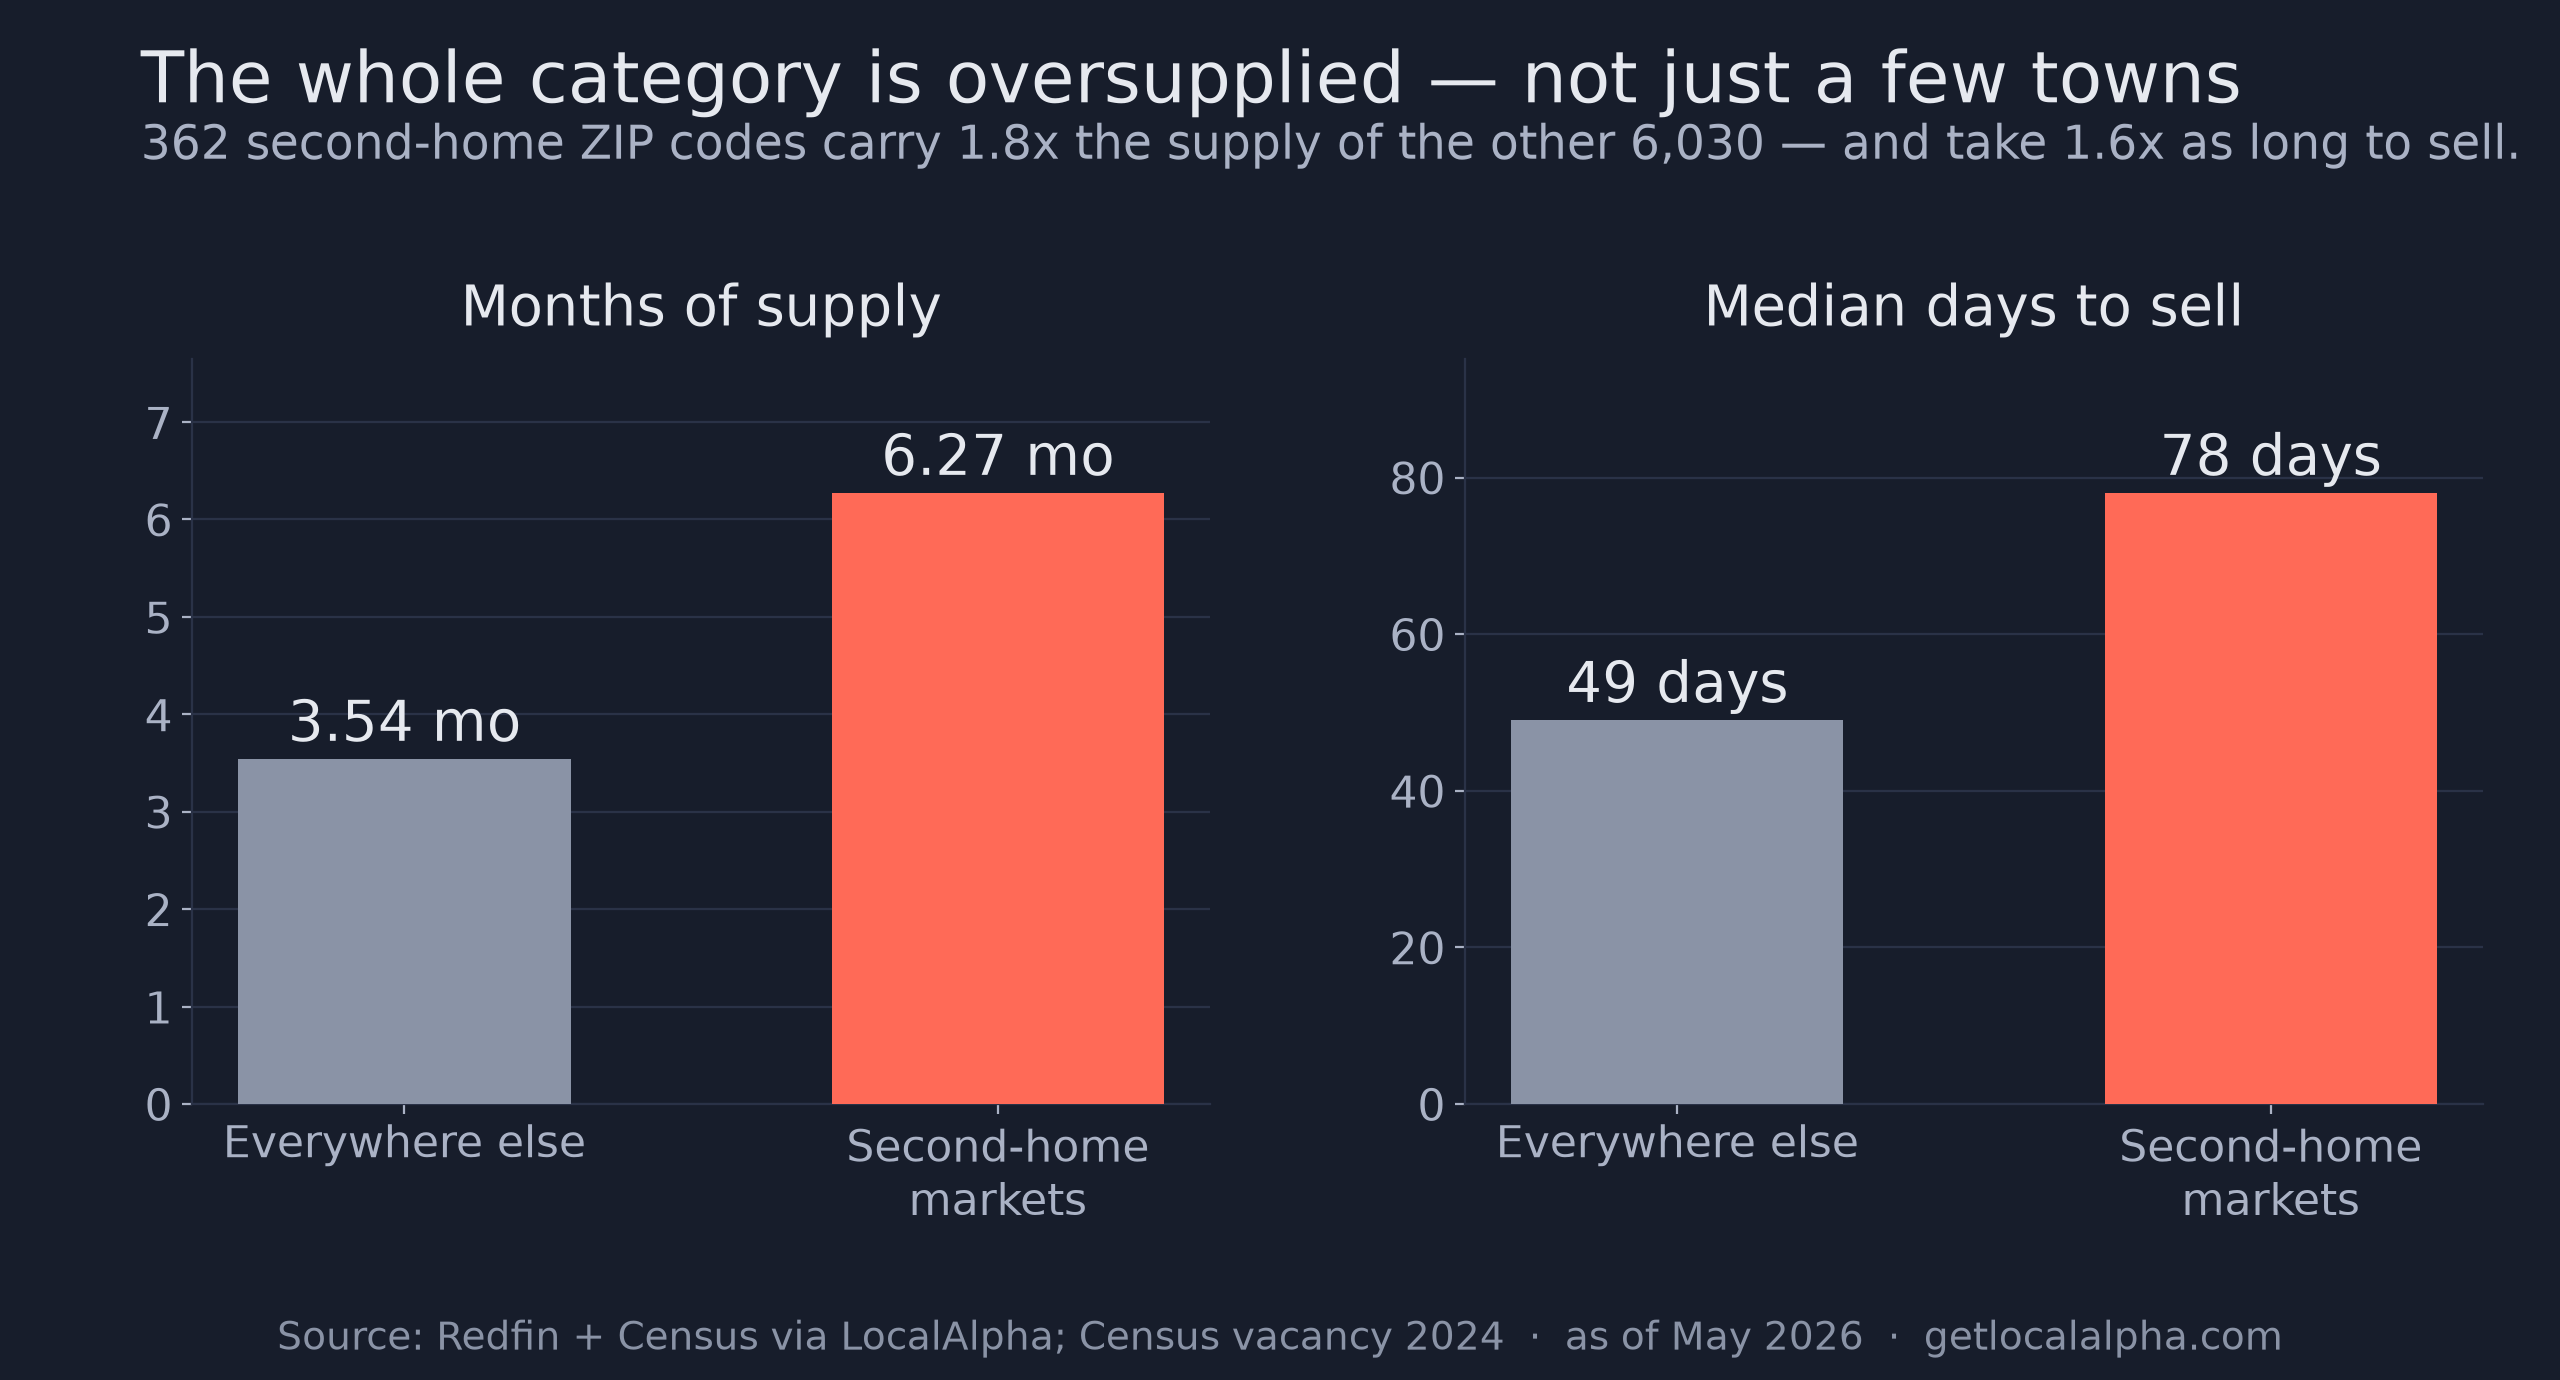
Both bars matter. The left one says there are nearly twice as many unsold homes per sale. The right one says they sit almost twice as long before selling. Supply and speed are separate measurements, and they agree.
What the data says
- Second-home ZIPs run a median 6.3 months of supply; the rest of the country runs 3.5.
- They take 78 days to sell versus 49 — the supply signal and the speed signal agree.
- This is a category-wide shift, not a handful of famous resort towns.
- At the extreme, a tail of markets is carrying more than a year of inventory.
The whole category moved, not just the famous towns
It would be easy to write about a few overbuilt ski towns and call it a trend. The number above says something broader. The median second-home market, not the worst one but the middle one, carries nearly twice the supply of the typical American ZIP code.
Plot all of them and the shape makes the case better than the median does. The whole distribution has slid right.
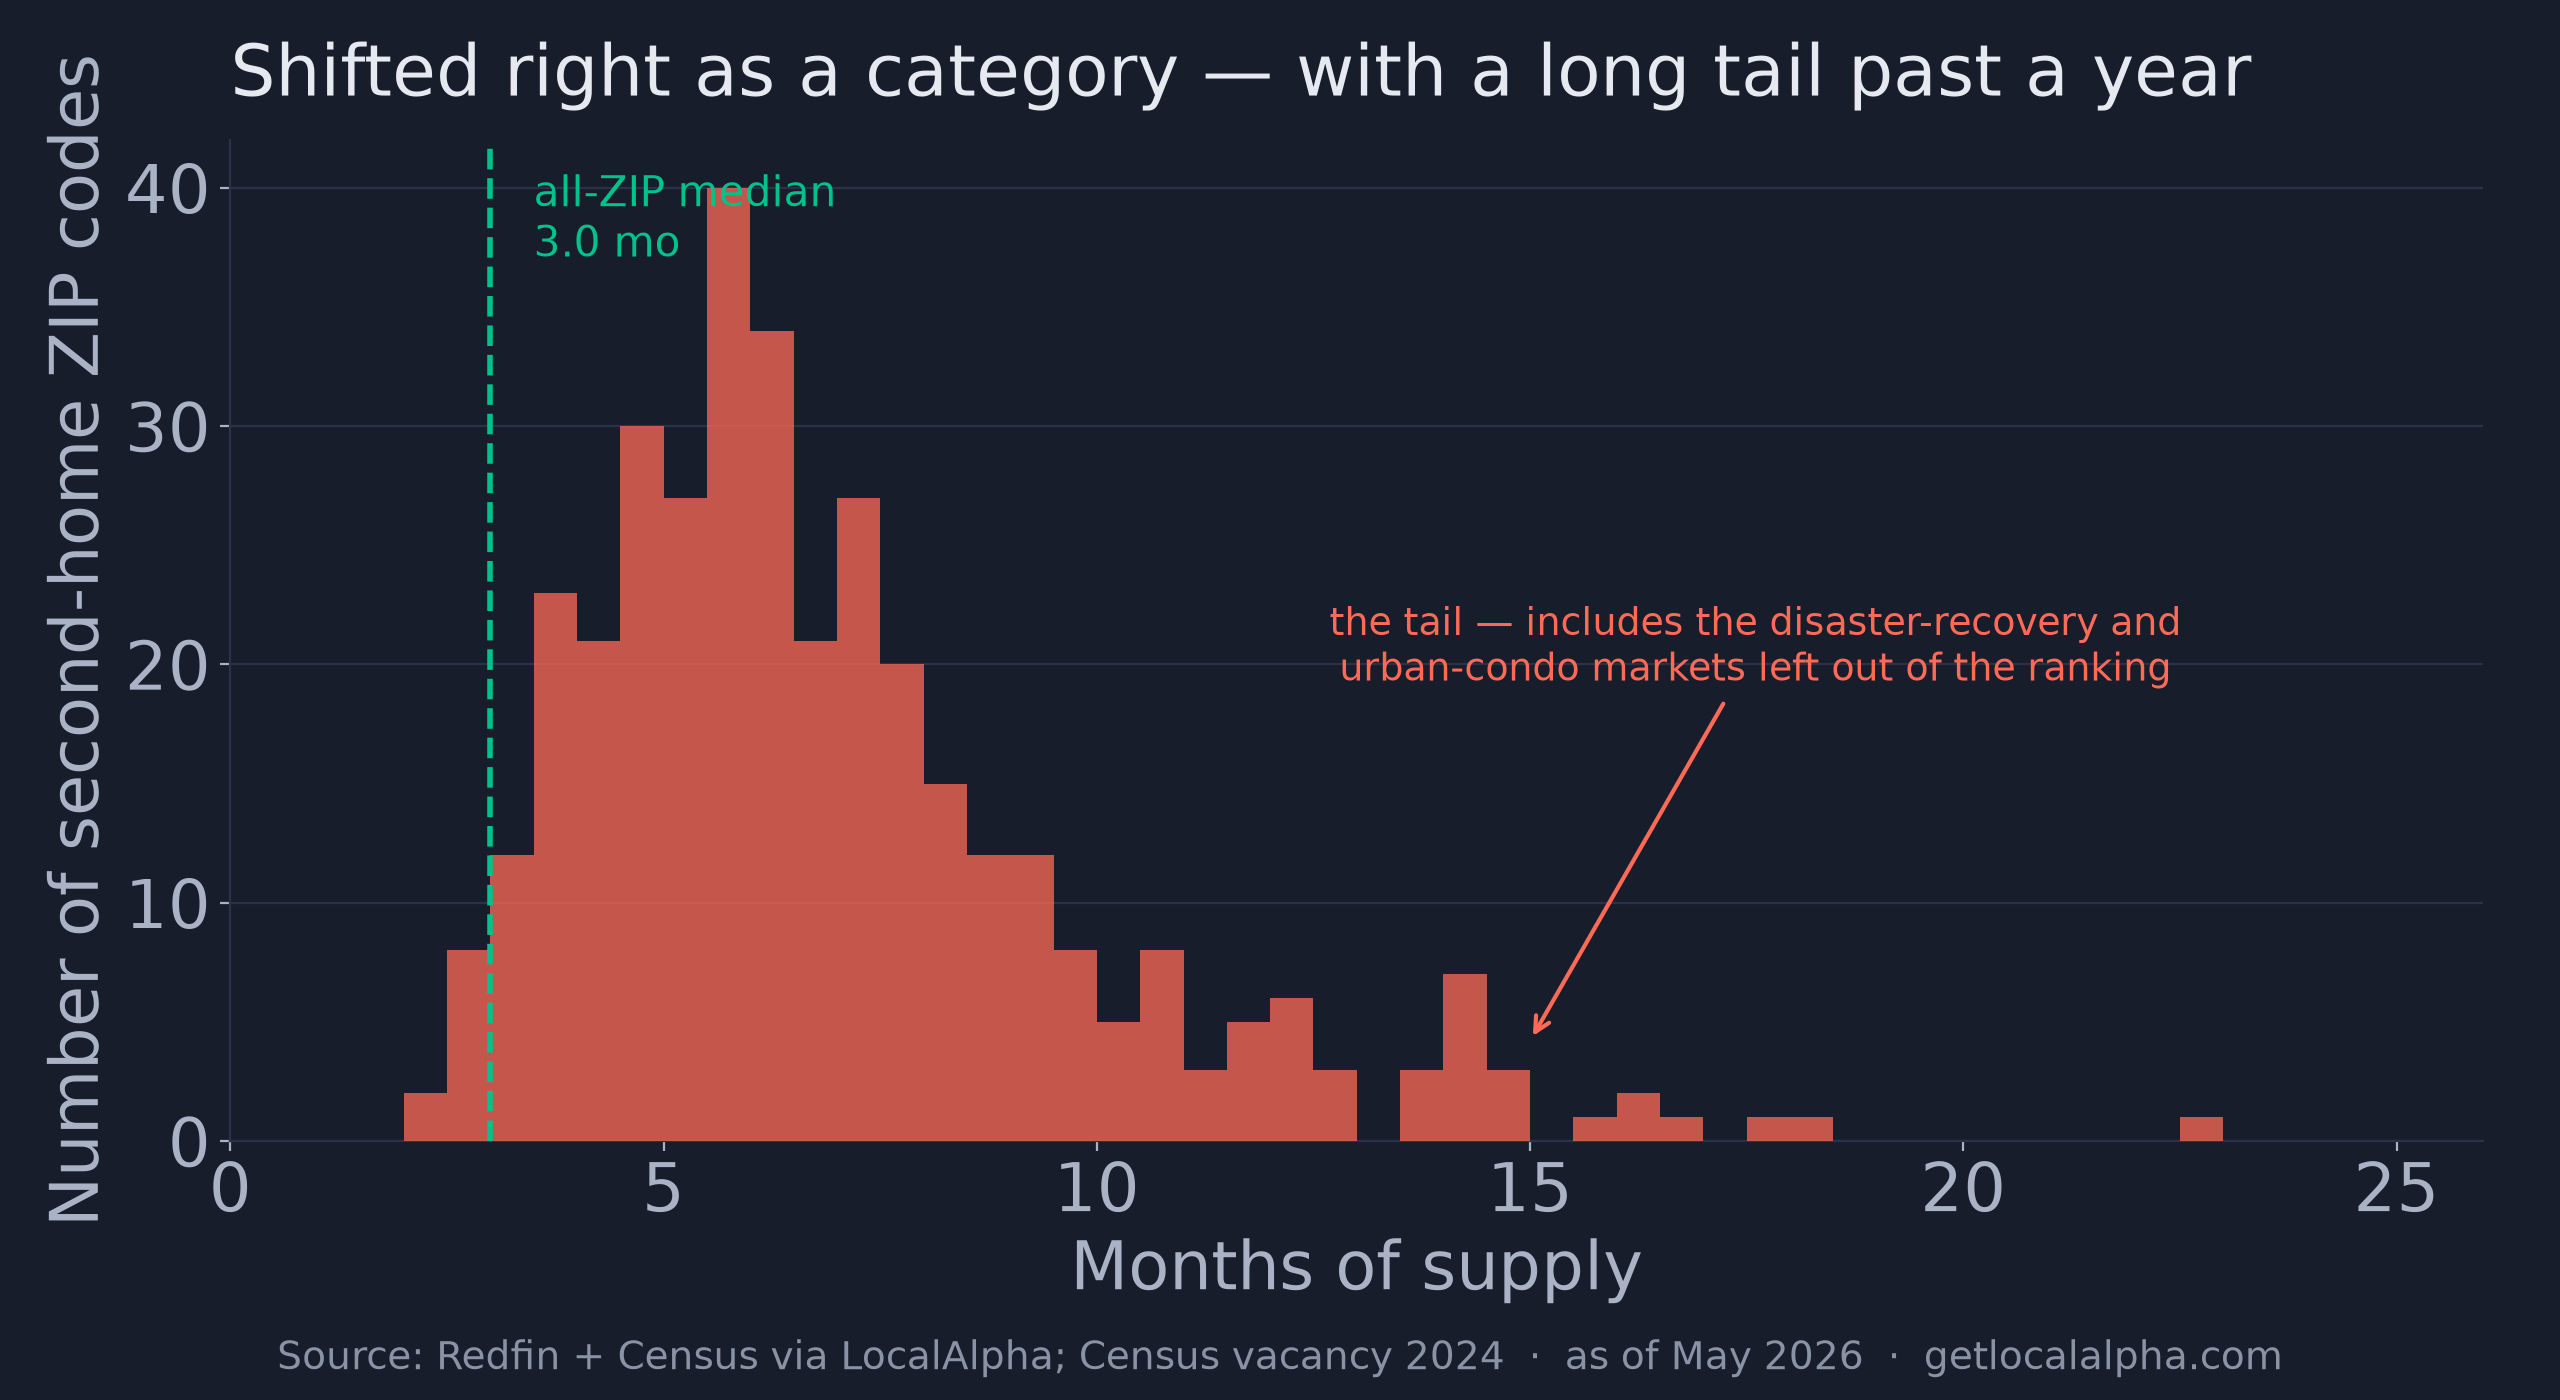
The hump sits between five and seven months, well right of the three-month national line, and the tail keeps going past fifteen. That is a category-wide condition with an extreme attached, not an average dragged around by a few outliers.
Two things are true at once, and most coverage picks only one: the category is broadly soft, and it has a genuine extreme. The extreme is where the headlines go. It is also where the numbers stop being abstract.
Where a year of inventory actually looks like
These ten all clear a materiality floor of at least twenty sales and fifty active listings. The green line is the national median. Every bar is more than four times it.
That floor is worth being honest about at the small end. ZIP 83429 (Island Park) and ZIP 95321 (Groveland) each recorded twenty-one sales in the quarter, and at that volume two extra sales would move either one by about 1.3 months — enough to reorder the middle of this list. The gap to the national median is far too large for that to threaten, but the exact rank of any single market here is not the point. The category is.
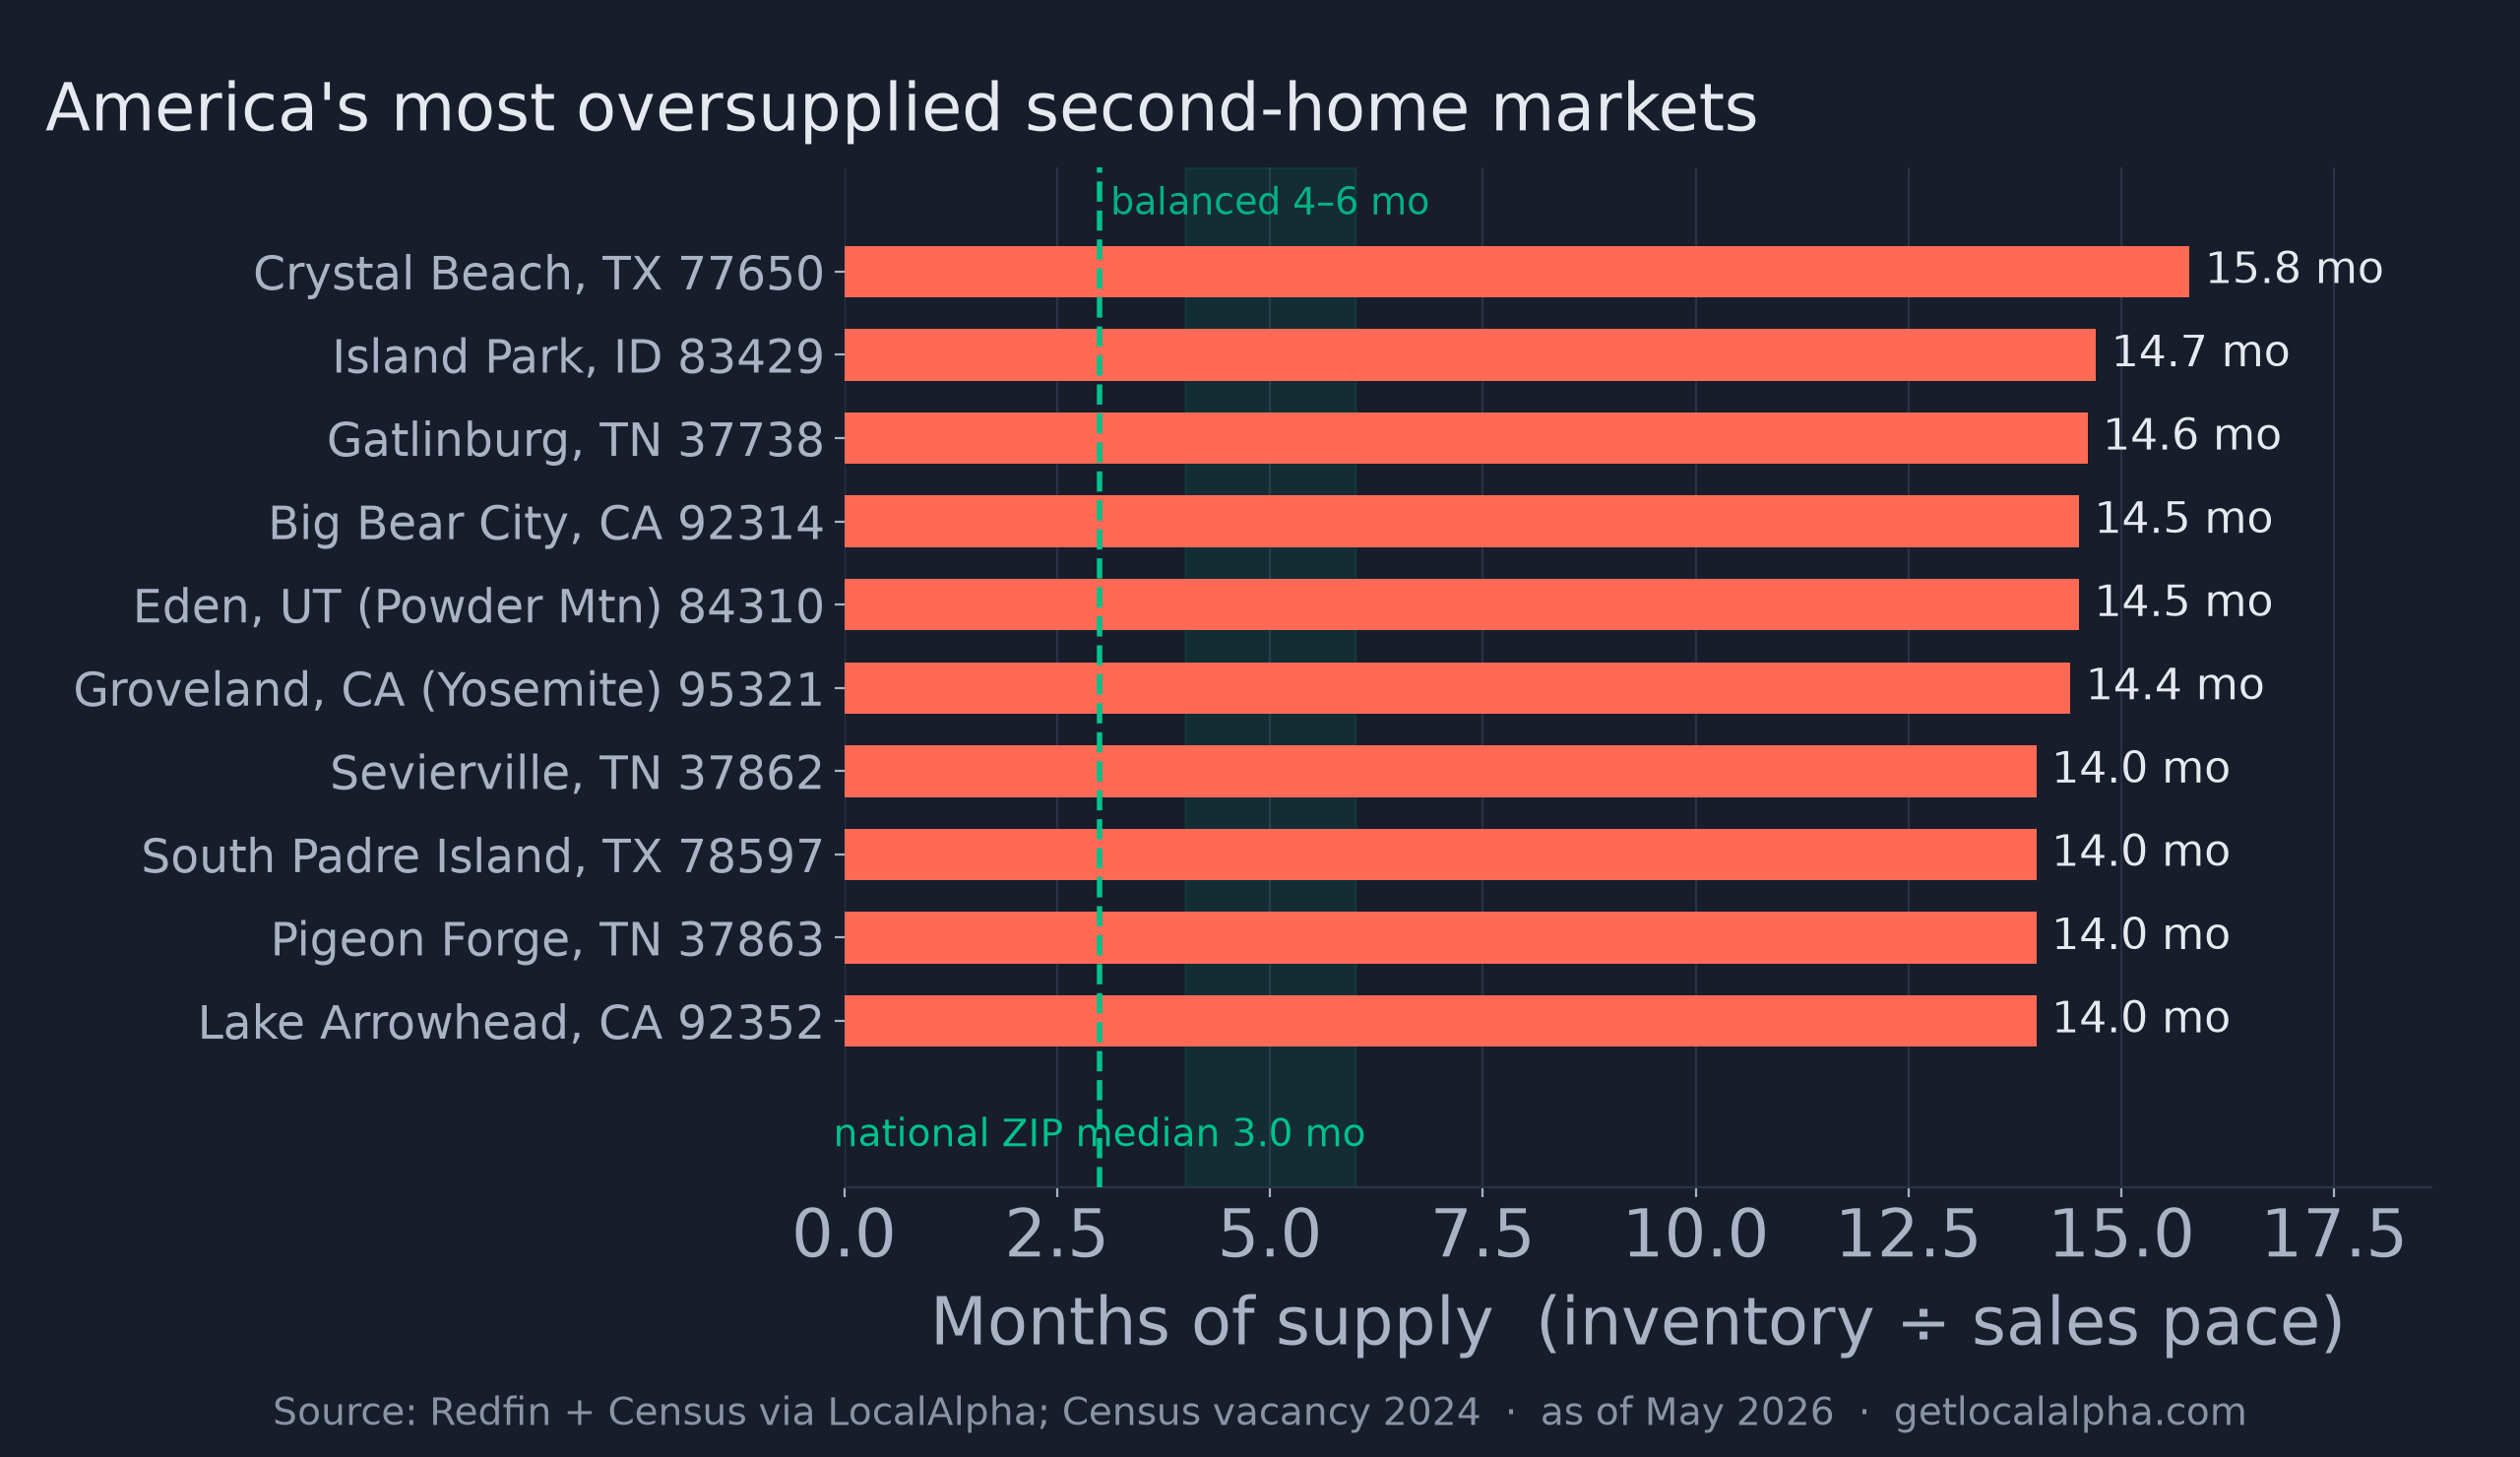
At the top is ZIP 77650 — Crystal Beach, Texas, on the Bolivar Peninsula, at 15.8 months. Its housing stock is unusually young, and there is a reason for that. When Hurricane Ike came ashore in 2008, the surge took most of the beachfront with it.
Almost everything standing there today went up afterward, bright houses set high on pilings. Nearly two decades on, that is a town that rebuilt itself. It explains why the homes are new.
It does not explain why they are unsold.
Behind it sits ZIP 83429, Island Park, Idaho, at 14.7 months: cabins and fly-fishing lodges at Yellowstone's western door, where the median listing takes 178 days to sell. Nearly six months, in a town whose selling season is measured in warm weeks. ZIP 92314, Big Bear City, California, the mountain weekend Los Angeles drives to, sits at 14.5, and ZIP 95321, Groveland, California, on the road into Yosemite, at 14.4. Two more sit between them on the chart: ZIP 84310 at Powder Mountain in Eden, Utah, and ZIP 37738, which the Smokies get to below.
These are not places people move to. They are places people buy a second one, and a lot of them did at roughly the same time. Look at three of them together and the pattern gets harder to call coincidence.
One road into the Smokies, three ZIP codes, one story
In November 2016, wildfire came down out of the mountains into Gatlinburg. Fourteen people died and a couple of thousand buildings were lost, and anyone who was there will tell you the town came back faster than seemed possible. A decade on, the cabins are full again.
A lot of what went up in those years went up as rental cabins. Gatlinburg's ZIP 37738 now carries 14.6 months of supply. Follow the same road nine miles north to Pigeon Forge, ZIP 37863, past Dollywood and the pancake houses, and it is 14.0. Nine miles further to Sevierville, ZIP 37862, Dolly Parton's hometown, and it is 14.0 again.
What probably happened
So what happened? The likeliest explanation is one the short-term-rental world already knows.
The 2021 boom pulled a wave of investor-buyers into vacation-rental cabins and condos. Then rates rose, insurance costs climbed hard in coastal and fire-country markets, some towns tightened rental rules, and nightly demand normalized. Homes bought as income machines came back to market together.
Rental-revenue trackers have reported the same oversaturation from the demand side. This is what it looks like on the for-sale side. To be clear about what we can and cannot show: the supply numbers are measured, the explanation is the most plausible reading of them, and we are labeling which is which.
How the markets were selected
A market qualifies as second-home if its total housing vacancy is at least 20% and its median sale price is at or above the national ZIP median. The price floor is what separates a resort town from a depopulating one — both show high vacancy, only one shows high prices. Every market shown clears a floor of at least 20 sales and 50 active listings, so nothing here is a thin-market artifact.
What it means on either side of the trade
So what do you do with it? If you have wanted a place in one of these towns, the cabin outside Gatlinburg or the stilt house at Crystal Beach, this is the most leverage you have had in years. A year of competing inventory is a year of other sellers making your argument for you.
If you are selling, the buyer pool that existed in 2021 is gone and the listing next door is not waiting. Price to the market that is actually there. In a market with fourteen months of supply, being the third-most-reasonable house on the street is the same as being unsold.
Want to know where the market you care about sits? Open it on the map and read its months of supply against the three-month national line. If it is a second-home market, compare it to 6.3 rather than to the country.
Check the supply picture in any market on the map.
Explore this market on the map
P.S. The markets I left out stuck with me more than the ones I put in. Malibu, West Maui, Ruidoso and Lake Lure would all have landed near the top of that list. They are recovering places, and that is a different piece than this one. Maybe worth writing on its own sometime.
Frequently asked questions
What counts as a normal months-of-supply figure?
Four to six months is the conventional balanced range. Under two is a tight sellers’ market; above six tilts toward buyers. The median American ZIP code is near three months. The markets at the top of this report are above fourteen.
How were these vacation markets identified?
By cohort, not by reputation: ZIP codes with high housing vacancy combined with above-median home prices. That combination isolates second-home markets and excludes high-vacancy areas that are simply losing population.
Does this mean vacation-home prices are about to fall?
This is a supply and time-on-market read, not a price forecast. It says buyers in these markets have unusual leverage right now. Whether that becomes lower prices depends on how long sellers are willing to wait.
Why exclude markets recovering from a disaster?
Their inventory is high because people were displaced, not because the second-home market cooled. Mixing the two would muddy the ranking, and writing about those places as a buying opportunity did not feel like the right call.
Metrics: months of supply (active inventory ÷ monthly sales pace) and median days on market, per Redfin data, 90-day window ending May 2026; vacancy and price cohort from Census. Charts are generated directly from the database and stamped with their as-of date. See the methodology.
Last updated Aug 16, 2026